Market Imaging
AT QCWAVE, one of the primary objectives is to utilize Geophysical tools for interpreting the S&P500 stock market index. The aim is to assess whether price cycles be predicted with a probability exceeding 60 percent. QCWAVE is actively engaged in conducting technical analysis of global financial markets, employing mathematical and statistical models based on Geophysical imaging.


Develop Innovative Tools
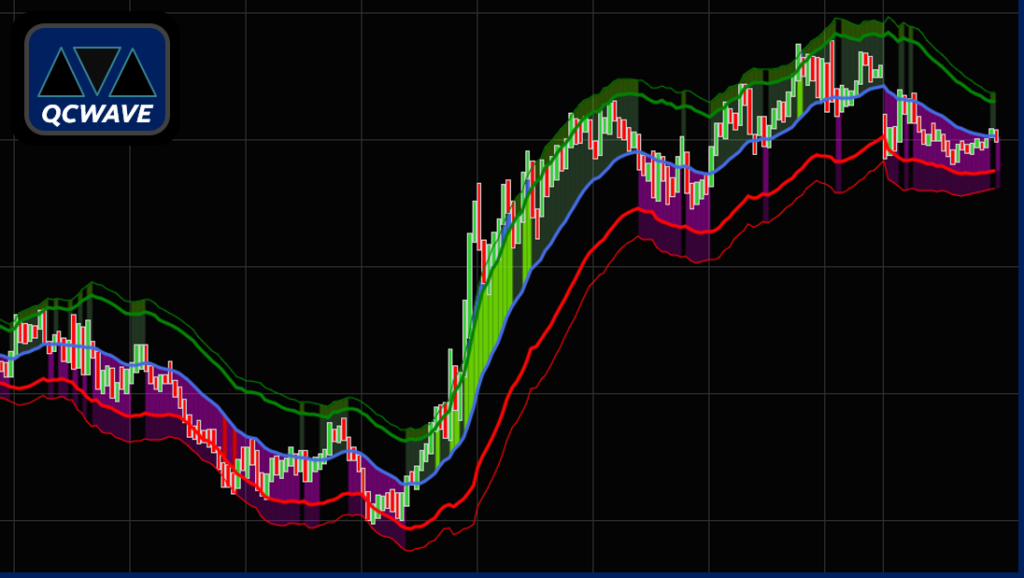
Traditional technical analysis uses long known MACD, RSI, Bollinger Bands and numerous Stochastic indicators which are all available to retail investors. AI coded algorithms have added a new layer of complex price movements for investors on shorter time frames which include intraday trading. Volatility, price and order flow are faster than 99 percent of retail traders. Daily indicators can reduce the chop of a fast moving market on shorter timeframes.
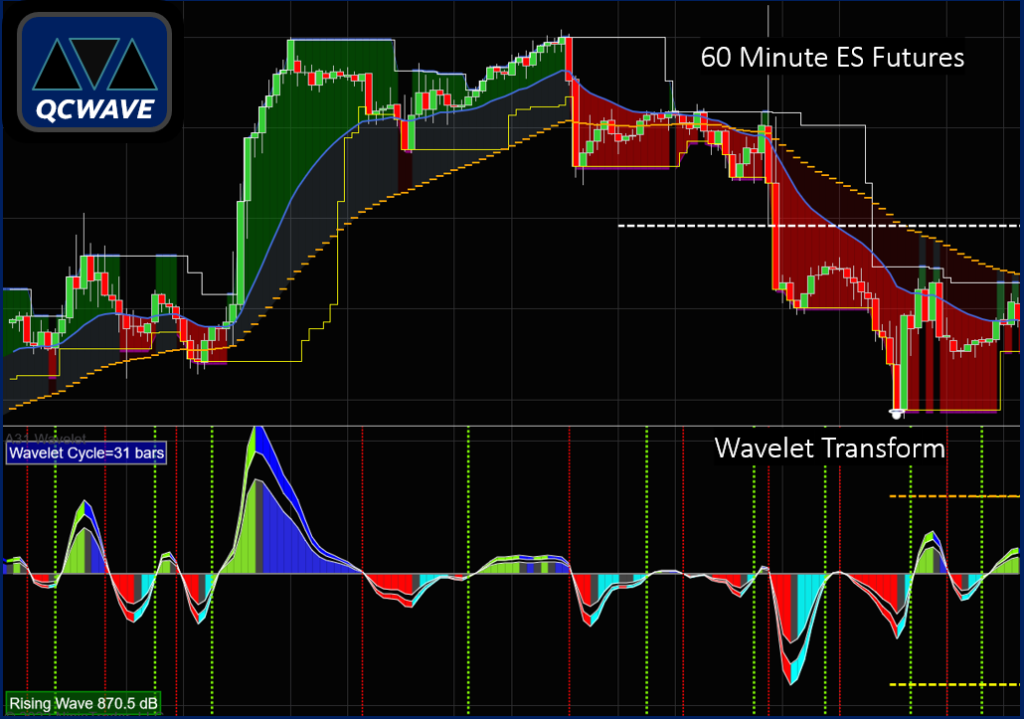
The lower image displays the wavelet transform designed by QCWAVE applied to the S&P 500 on 60 minute intervals. The polarity of the wavelet gives long and short position signals crossing the zero line. The wavelet transform is sensitive to market cycles which are data dependent. In attempting to improve the resolution, cycles are measured from the spectrum over small time frames.

Advanced Technologies

A partial list of cutting-edge technical indicators developed at QCWAVE include:
- Machine Learning pattern identification and price projections based on structure.
- Market Internals – price, volume, and model amplitude.
- Volatility measurements and price prediction models
- Multi timeframe wavelet spectrum analysis. Market cycle frequency analysis.
Wedge Market Models
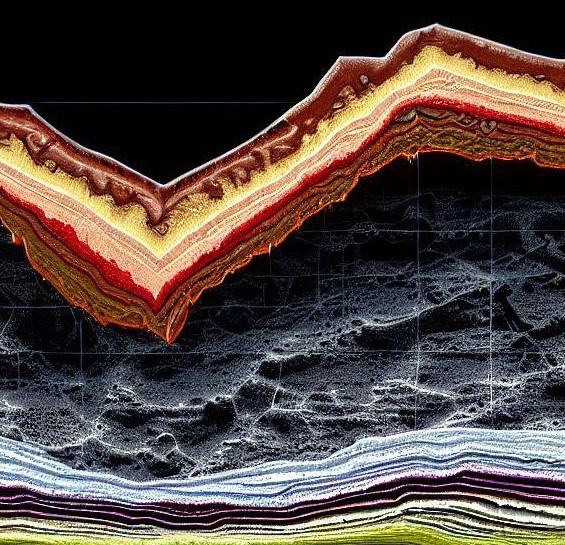
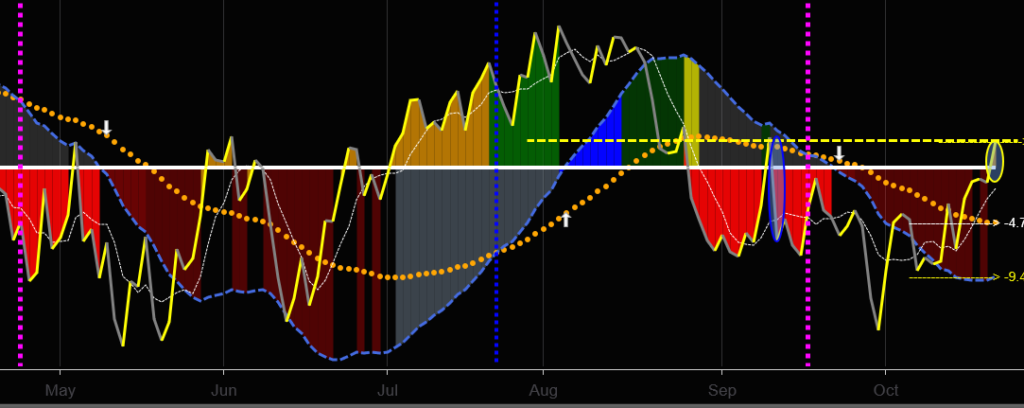
By employing a Wedge model, QCWAVE aims to minimize high-frequency noise and improve the representation of financial time series data, replacing the conventional bars and candlesticks. The daily longwave length model shares similarities with time static seismic models used in geophysics. Below is an illustration of the S&P 500 Index from May 2022 – October 2022. The white line represents a zero line. Four levels of rising and falling statistical data points provide signals for long and short positions.

A Wavelet tutorial
Steven Brunton, University of Washington
